Culinary Draw and Casino Floor Dynamics: Links Observed Between Fine Dining Reservations and Table Game Occupancy Rates

Resort operators across major gaming markets track reservation volumes at signature restaurants alongside occupancy metrics at nearby table game pits, and patterns emerge when high-end dining bookings rise during peak evening hours. Data from property management systems shows that evenings with elevated fine dining reservations often coincide with steadier foot traffic through adjacent blackjack and roulette areas, particularly at properties where restaurants sit within short walking distance of the main gaming floor.
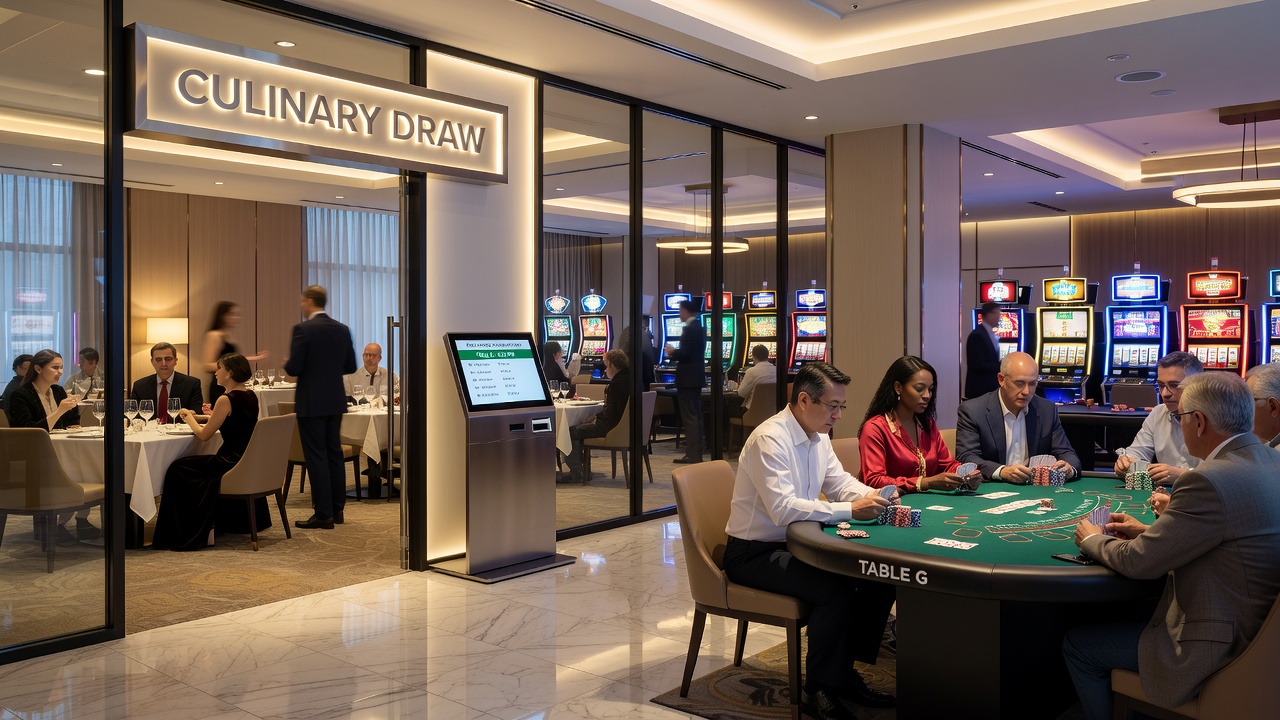
Analysts at several Strip resorts note that guests holding 8 p.m. reservations frequently arrive 30 to 45 minutes early and spend that window at nearby tables, while post-meal lingerers sometimes return to the floor rather than heading straight to exits or hotel towers. This sequence creates measurable spikes in table game headcount during specific blocks rather than uniform distribution across the night.
Reservation Timing and Pit Activity Patterns
Systems that integrate restaurant reservation platforms with table game tracking software reveal consistent clusters where occupancy climbs between 7:15 p.m. and 9:45 p.m. on nights when popular dining venues reach 85 percent or higher capacity. Observers note that this window aligns with typical arrival buffers and post-dinner returns, especially on Fridays and Saturdays when both culinary and gaming demand peak together.
One property in the center Strip reported that nights featuring sold-out seatings at its signature steakhouse showed average table game occupancy rates 12 to 18 percent higher during those targeted hours compared with nights when the same restaurant operated at 60 percent capacity. Similar correlations appear at off-Strip and downtown locations, though the strength of the link varies with physical layout and promotional bundling.
Layout and Traffic Flow Considerations
Casino designers place high-limit rooms and popular table game banks within sightlines of restaurant host stands at multiple Nevada properties, and this proximity supports the observed movement between dining and gaming. When pathways remain clear and signage directs guests efficiently, the transition from reservation check-in to table seating happens with minimal friction, sustaining the flow that contributes to higher occupancy counts.
Properties that recently adjusted floor plans to position table games closer to new or renovated dining outlets have recorded corresponding shifts in hourly occupancy data. These adjustments often involve relocating certain blackjack pits or adding additional roulette wheels in zones that capture both pre-dinner and post-dinner foot traffic.
Data Integration Across Departments
Revenue management teams now pull combined datasets that merge point-of-sale records from restaurants with real-time table game occupancy feeds, allowing planners to forecast staffing needs more precisely. When reservation systems project strong dining nights, pit managers receive advance notice and adjust dealer schedules accordingly to match anticipated demand windows.
Studies conducted by university gaming research centers have examined these integrated datasets across multiple jurisdictions, and findings indicate that properties with tighter coordination between culinary and gaming departments experience fewer instances of understaffed tables during high-reservation periods. The approach relies on shared dashboards rather than separate departmental silos.
Regional Variations in June 2026 Reporting
Figures compiled for June 2026 from properties in Nevada, New Jersey, and several tribal gaming states show that the correlation between fine dining reservations and table game occupancy holds across different regulatory environments, though magnitude differs by market maturity and visitor demographics. Markets with higher concentrations of convention traffic tend to display stronger evening overlaps, while destination leisure markets show more weekend-specific patterns.
According to reports issued by the Nevada Gaming Control Board, aggregate table game drop during prime dining hours increased at several major resorts during months when culinary reservation platforms indicated above-average booking velocity. These reports aggregate data without attributing causation, yet they document the temporal alignment that operators monitor internally.
Future Tracking Methods
Emerging sensor technology and anonymized mobile location data now supplement traditional headcount methods, giving operators finer resolution on how long guests remain in specific zones after leaving restaurants. Early deployments of these tools at select properties provide additional confirmation that many diners pass through or return to table game areas within defined timeframes.
Industry groups such as the American Gaming Association continue to compile cross-property benchmarks, and participating operators share aggregated insights that help refine expectations around culinary and gaming interplay without disclosing proprietary details. These benchmarks serve as reference points for new properties planning their floor and restaurant configurations.
Conclusion
Observed connections between fine dining reservations and table game occupancy rates rest on coordinated data streams and physical layout decisions that place these amenities in close proximity. Properties that monitor both streams together gain clearer pictures of hourly demand cycles, which supports more accurate staffing and floor management. As tracking tools grow more sophisticated, the documented patterns are likely to inform future design choices across additional markets.